
The traffic trap
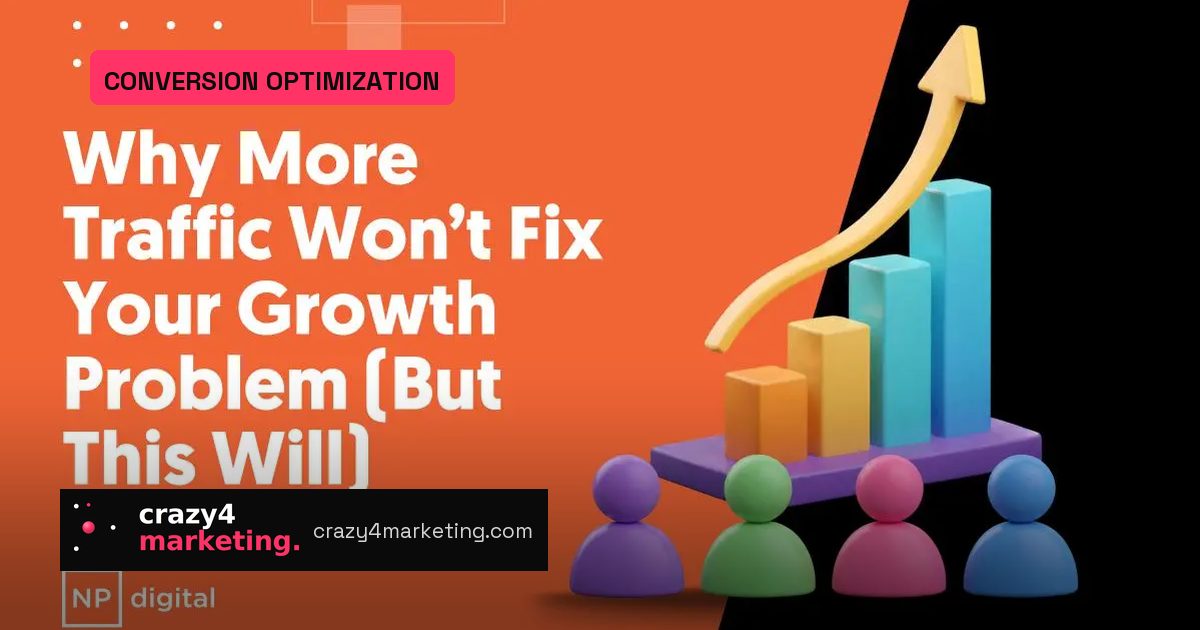
Most teams read a flat revenue line as a traffic shortage. They buy more clicks, watch impressions and sessions rise, and then wonder why the dashboard looks busy but the pipeline does not. NP Digital’s 2026 research names the pattern: more impressions does not equal more clicks, more sessions does not equal more conversions, and more leads does not equal more revenue.
Each step has its own leak point. Sending more visitors into the top of a leaky funnel just routes more people through the same broken experience. Meanwhile acquisition costs rise: CPC climbs across major ad platforms, organic click-through rates drop as AI answers replace traditional search results, and buyers need more touchpoints before converting. The acquisition layer has a ceiling; conversion does not.
Where the leverage actually sits
NP Digital looked at businesses generating at least $10 million in annual revenue that invest in both CRO and traffic generation. Conversion rate delivered 68 percent of the impact, while traffic delivered 32 percent. Yet 93 percent of teams still put most effort into traffic, and only 7 percent focus on conversion rate.
The testing data makes the same case. Teams running fewer than five tests per quarter saw 2.7 percent revenue growth. Teams running 11 to 15 tests per quarter saw 5.6 percent growth, more than double. The sweet spot is roughly four tests a month; beyond that, teams do not have enough time to absorb results before the next launch.
Four leaks that quietly kill conversion
NP Digital’s funnel audits trace most drop-off to four categories:
- Messaging problems: visitors cannot quickly answer what you do, why you are different, and why they should trust you.
- Friction problems: long forms, slow pages, extra steps, and complicated checkouts create resistance at the decision point.
- Trust problems: missing reviews, case studies, testimonials, and social proof ask visitors to decide without enough evidence.
- Experience problems: poor mobile UX, weak navigation, and confusing journeys pull people off the intended path.
The leak location varies by model. B2B teams lose 59.4 percent of leads between lead and marketing-qualified lead, while B2C teams lose 32.8 percent between add-to-cart and checkout. The biggest tested gains also come from the middle of the funnel: 49 percent for B2B and 43 percent for B2C.
Page benchmarks are a reality check. Checkout pages convert at 26.8 percent on average, lead generation pages at 4.1 percent, product pages at 2.0 percent, contact pages at 1.6 percent, and homepages at just 0.02 percent. The checkout number still means nearly 75 percent of visitors abandon after reaching the final step.
A repeatable CRO system
The teams that win treat CRO as an operating rhythm, not a one-off redesign. The framework is simple:
- Research: use analytics, heatmaps, session recordings, and customer feedback to find real drop-off points.
- Prioritize: rank by traffic, revenue impact, and effort, then fix the biggest leak first.
- Test: change one variable at a time across headlines, offers, CTAs, form length, layout, or pricing presentation.
- Scale: apply winning changes across the rest of the funnel, not just the page where the test ran.
Before scaling a “winner,” check whether bot or AI-agent traffic skewed the result, whether users actually followed the expected path, whether abandonment rose elsewhere, and whether the projected revenue lift justifies the build time. Statistical significance alone is not enough.
Measure value, not just conversion rate
A higher conversion rate can hide worse unit economics. A discount code field may lift conversion but lower average order value or attract leads that never close. The stronger scorecard tracks revenue per visitor, customer acquisition cost, lead quality, and customer lifetime value.
Trust is the hidden multiplier. In one NP Digital study, only 18 percent of visitors felt trust on a site, while 46 percent of companies believed that visitors felt it. That gap is where most offers die.
Your first 60 days
Start by diagnosing pages, forms, checkout, heatmaps, and funnel abandonment for 15 days. Next prioritize the highest-traffic and highest-revenue leak points and test for 15 days. Scale winning elements for another 15 days, then operationalize a monthly testing calendar, backlog, and prioritization framework. That turns CRO into a compounding program instead of a quarterly rescue mission.
Source: Neil Patel