

Buffer’s new analytics suite, Buffer Insights, pulls follower growth, engagement and impressions from Instagram, Facebook, X, LinkedIn, TikTok, Pinterest, Threads, Substack Notes, Bluesky, YouTube and Mastodon. The real story is not the dashboards: it’s how Buffer’s own marketing team uses four features to cut planning time and prove results.
Plan a month with the Claude connector
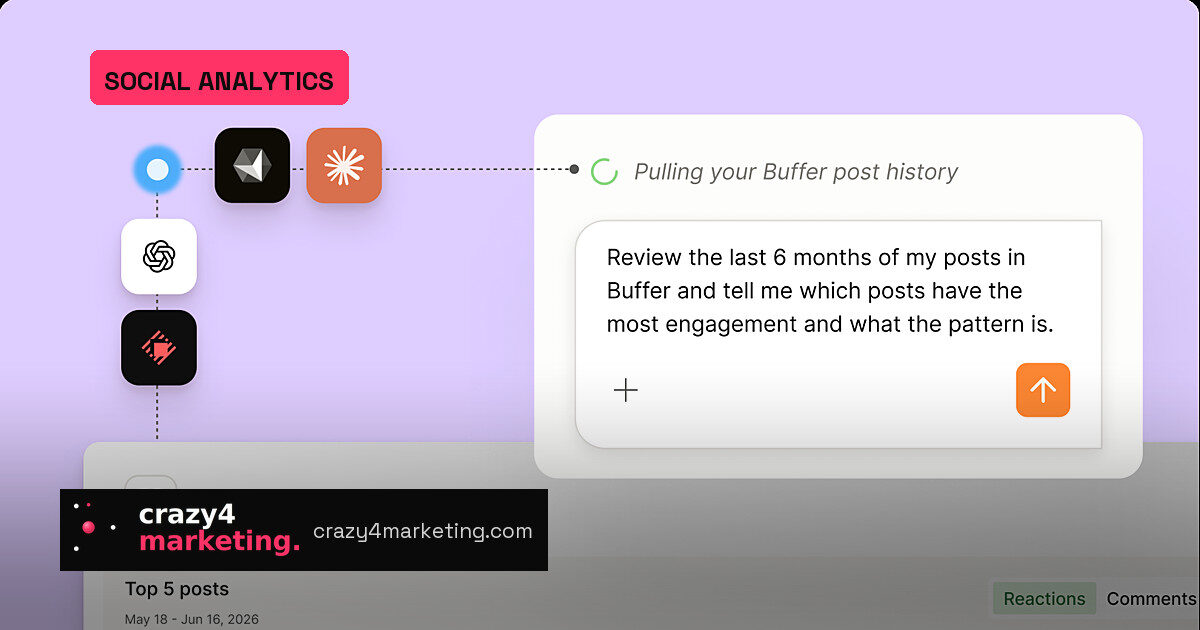
Buffer has an MCP connector that brings social data into Claude, ChatGPT and other AI tools. The workflow is simple: ask the AI to pull the past year of Buffer data and identify the topics and post types that resonated most. That turns a blank monthly calendar into a rough content plan in minutes.
This is a shift from using AI to write captions to using AI to read performance data and shape strategy. It reduces the mental load of constant content decisions, and it plays to what AI is actually good at: pattern-spotting across a long history of posts.
Keep a weekly pulse, not just a monthly plan
A monthly plan is a starting point, not a contract. The Weekly Pulse shows how many posts have gone out, how follower growth is tracking and how much engagement the content is earning. That makes it easier to adjust mid-week when a trend pops or a product update needs attention.
The product marketer also highlights a metric worth stealing: comment score. Replying to comments is a reliable way to boost post visibility, so tracking it weekly turns engagement into a habit.
Tags turn launches into comparable cohorts
Instead of judging a launch by scattered individual posts, tag every post in the same campaign when you schedule it. Then filter by that tag in Insights to see the group’s total performance.
Buffer tested this with its Substack Notes launch. Six tagged posts on launch day produced 254 engagements and 17,000 impressions. Because each launch gets its own tag, the team can compare launches over time and learn which metrics actually predict success.
Reports that match how teams actually work
Social data is useless if it stays inside the tool. Buffer Insights exports reports as PNG, PDF, CSV or Markdown. The fastest option is a PNG snapshot: drop it into Slack to highlight a win without building a deck.
The workflow forms a monthly loop:
- Start by planning with the Claude connector.
- Check the Weekly Pulse and adjust as you go.
- Tag launch posts to measure them as a group.
- End by sharing a PNG report with stakeholders.
Buffer Insights is available on every plan, including the free one. That lowers the barrier for small teams and solo marketers who want analytics without another subscription.
Why this matters
The useful idea here is not “more dashboards.” It is a repeatable workflow: plan with AI, review weekly, measure launches as cohorts, and report in the format that spreads fastest. If you are drowning in platform-native analytics, that loop is worth copying even before you switch tools.
Source: Buffer: All-you-need social media toolkit for small businesses