

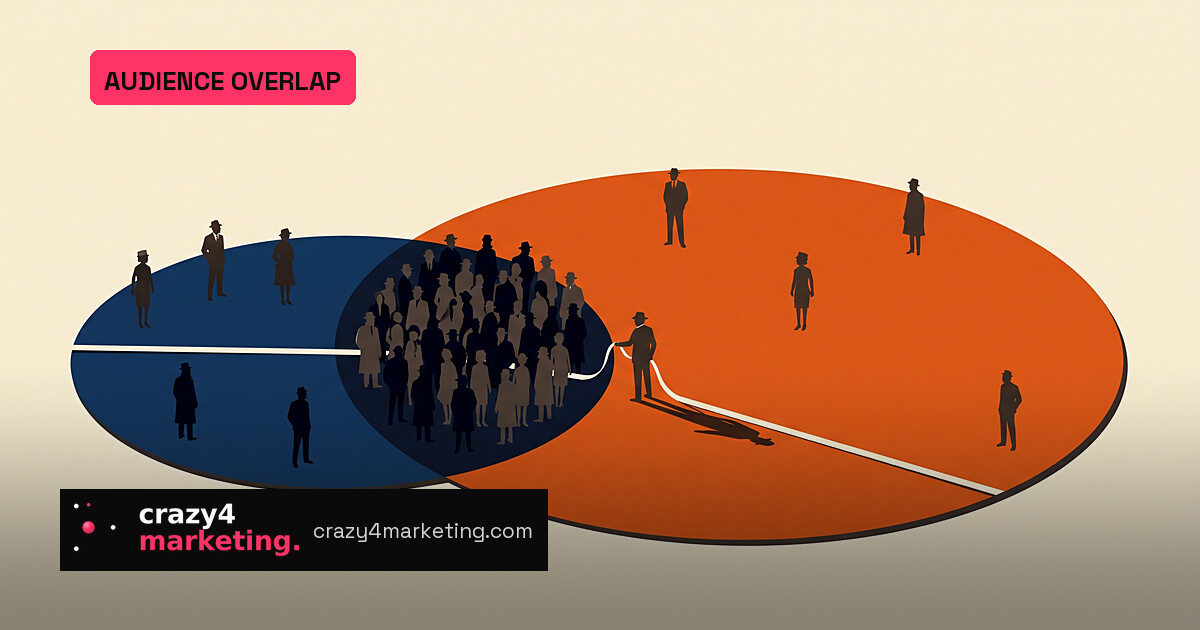
That new audience you just bought may be full of people you have already reached. Audience overlap analysis counts users who appear in two or more lists at once, and it is the fix for a costly blind spot: buyers cannot tell whether a second segment brings fresh reach or simply charges twice for the same users.
The arithmetic predates ad tech. Botanist Paul Jaccard published what became the Jaccard index in 1901 to compare alpine plant species. Media planners later borrowed it for readership and viewing panels, and digital platforms turned the estimate into a direct count.
One intersection, three very different stories
The method is a set intersection. Choose a common match key—hashed email, phone number, mobile advertising ID or a third-party identifier—and count the records present in both audiences. The ratios that follow depend on which audience you divide by.
A retailer with 200,000 customer records and a publisher with 2 million subscribers share 50,000 people. Against the retailer’s file, overlap is 25%. Against the publisher’s base, it is 2.5%. The Jaccard index, dividing shared users by the combined union, comes in around 2.3%.
Same intersection, different headline. Most tools pick a ‘primary’ audience without always saying so, which is why you should ask about the denominator before comparing.
Where the analysis actually runs
- Meta’s Audience Overlap tool compares your own audiences and requires at least 1,000 people per list.
- Display & Video 360 and Campaign Manager 360 report reach overlap by campaign and placement.
- Clean rooms from AWS, LiveRamp, Adobe and others run overlap as the first query before any data is joined.
- The PAIR protocol carries matched publisher lists into programmatic auctions.
Privacy thresholds shape every result. Ads Data Hub has required around 50 unique users per row in some legacy queries, around 20 with noise injection and about 10 for click-only. Adobe suppresses comparisons with fewer than 1,000 overlapping identities. Small intersections vanish, so reports bend toward large audiences.
Clean rooms have made overlap a standard starting point. In the New York Times case, Decentriq found that one in four of a wealth manager’s customers were also Times readers, and that shared group became the seed for lookalike segments.
Why it matters for measurement
A TransUnion and EMARKETER survey of 196 US marketers, published in October 2025, found 48% named cross-channel deduplication as a barrier to trusting measurement. Amazon cited a consumer goods company that found 34% reach overlap across three brands’ orders.
One caveat: overlap is not incrementality. Two audiences can share very few people and still reach buyers who would have purchased anyway. The duplication number says nothing about marginal lift.
Three checks before you trust any overlap figure
First, confirm the match key and match rate—records that fail to link are invisible, so overlap can never exceed the share that matched. Second, ask which denominator the tool uses. Third, run the analysis before buying or consolidating ad sets, and don’t treat rules of thumb such as 40% to 60% overlap as a hard saturation ceiling.
Source: PPC Land